
Following the recent Bitcoin (BTC) halving, the cryptocurrency landscape is focused on the asset’s future price trajectory.
As Bitcoin struggles to maintain its pre-halving stability above $65,000, investors and analysts are keenly observing its price behavior for clues about what lies ahead.
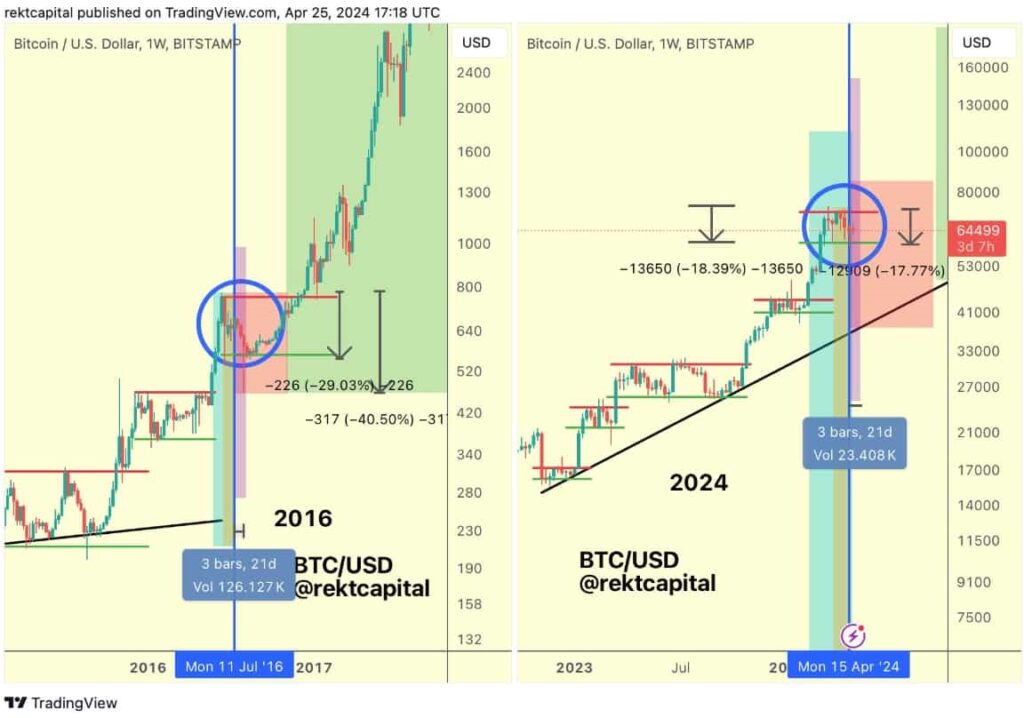
In an X (formerly Twitter) post on April 26, crypto analyst Rekt Capital raised concerns about a potential “Danger Zone” following Bitcoin’s recent halving event.
The concept of the ‘Danger Zone’ draws from patterns observed in previous cycles, such as in 2016, when Bitcoin’s price dropped approximately 11% about 21 days after the halving. Currently, only six days post-halving, the market is braced for similar turbulence, potentially culminating around day 15.
According to him, the ‘Danger Zone’ is pivotal not only for its potential for price dips but also as a setup for what might follow—an extended ‘Re-Accumulation Range.’ Historical data suggests that after the initial drop, Bitcoin often enters a consolidation phase lasting up to 150 days. This period is crucial for stabilizing the market and setting the stage for the next bullish breakout, anticipated around September 2024.
BTC price analysis
But how long would an ideal Re-Accumulation Range last? When Bitcoin reached a new All Time High in mid-March, this meant that Bitcoin was accelerating in its cycle by 260 days.
But since Bitcoin has consolidated for over the past 49 days, this acceleration has now dropped to 210-days or so. If Bitcoin were to repeat history and consolidate in this Re-Accumulation Range for a total of 150 days after the Halving…This would still mean that Bitcoin is accelerating in this current cycle but to a lesser extent and only by 60 days
-Rekt Capital
BTC price analysis
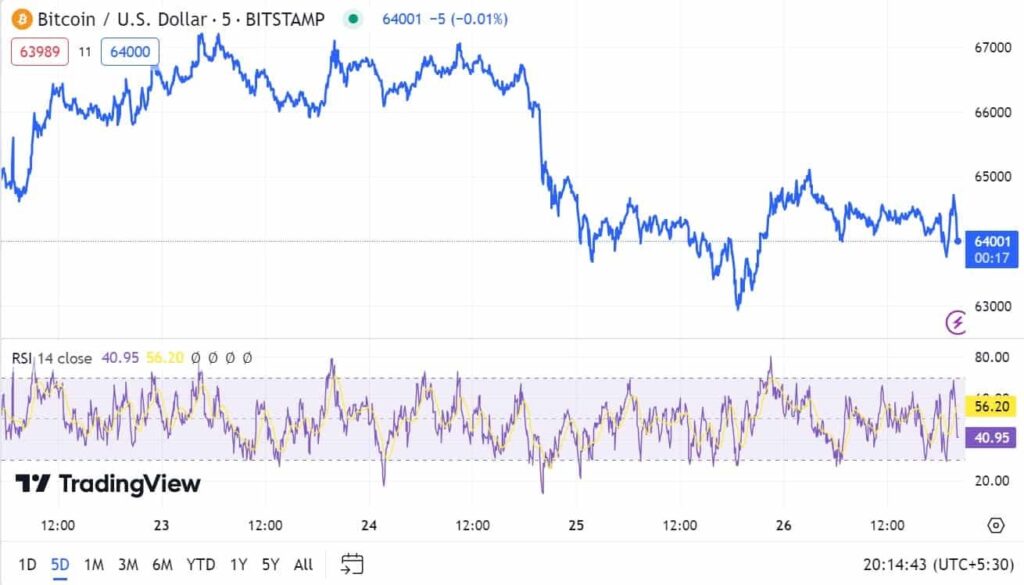
Over the past five trading days, BTC has exhibited typical cryptocurrency volatility, with both upward and downward movements. The Relative Strength Index (RSI) has remained in neutral territory, fluctuating between 47 and 63, which indicates balanced market sentiment, with the highest RSI value on April 22nd nearing the overbought threshold at 63.
The market’s price action has been confined within a defined range, establishing support around the $63,500 mark and resistance at approximately $67,200. These boundaries underscore a consolidation phase where the price oscillates without a clear directional breakout.
Furthermore, significant whale activities have influenced the cryptocurrency market, with substantial movements of Bitcoin. This coincides with recent U.S. economic data indicating rising inflation and slowing GDP growth, adding to market uncertainty.
Despite these bearish signals, the community is closely watching for any events that could quickly alter price trajectories.
For investors and traders, the coming weeks will be critical. The ability of Bitcoin to hold above key support levels, especially around the $60,600 mark, will provide valuable insights into its resilience and potential for recovery.
Monitoring these trends will be essential for anyone looking to understand Bitcoin’s post-halving behavior, particularly as the “Danger Zone” unfolds.
Disclaimer: The content on this site should not be considered investment advice. Investing is speculative. When investing, your capital is at risk
The post Bitcoin in ‘post-halving danger zone’; Here’s what it means for BTC appeared first on Finbold.