
In recent weeks, the Pakistani Rupee (PKR) has generally been on a losing streak against the U.S. Dollar (USD), though the latest trading day saw a slight climb and moderate gains by April 25, 2024, having appreciated 0.03% in the opening hours of Thursday trading.
Still, though sailing is not expected to be entirely smooth in the coming period, partially due to an expected slowdown of Pakistan-bound remittances from abroad as Ramadan grows increasingly distant, PKR is expected to receive some boons soon.
Crucially, the executive board of the International Monetary Fund (IMF) is set to meet on Monday, April 29, and discuss the approval of $1.1 billion in funding for Pakistan.
The results are expected to be positive as highlighted by the optimistic comments on the cooperation between the country’s government and the IMF made recently by the U.S. Ambassador Donald Blome.
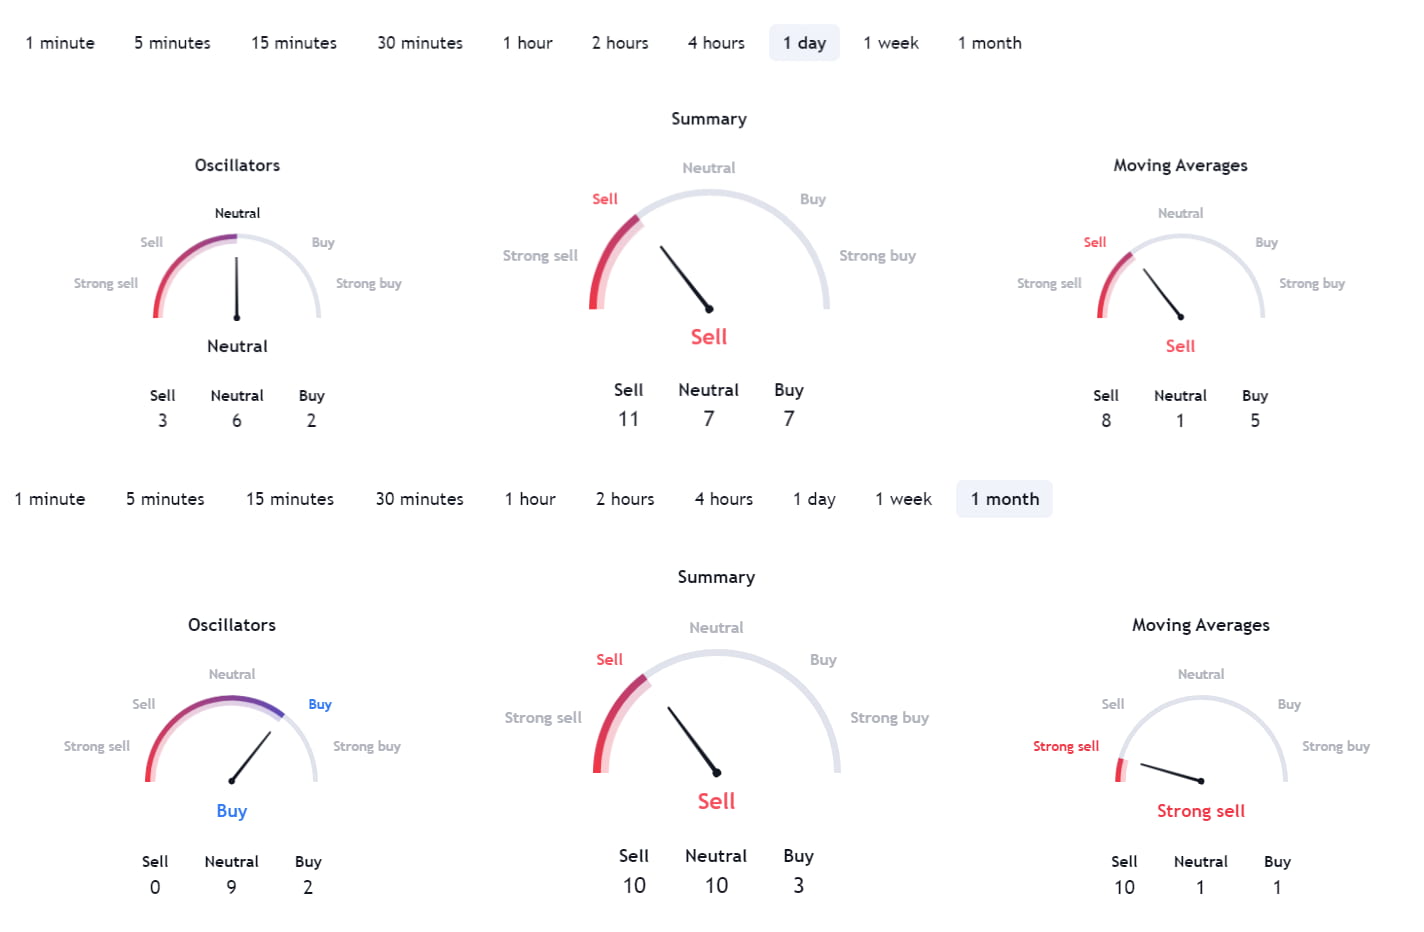
Pakistani Rupee technical analysis
While there is some optimism about what is coming for the PKR, technical analysis (TA), retrieved from TradingView on Thursday, April 29, indicates a bearish sentiment.
Indeed, the Pakistani rupee is regarded as a ‘sell’ in the analysis based on the last 24 hours of trading, as well as the one based on the monthly chart.
In the two timeframes, moving averages (MA) read either ‘sell’ for the former or ‘strong sell’ for the latter. Oscialltors are more optimistic in both cases and are neutral on the latest 24 hours but turn to a ‘buy’ when assessing the latest 30 days.
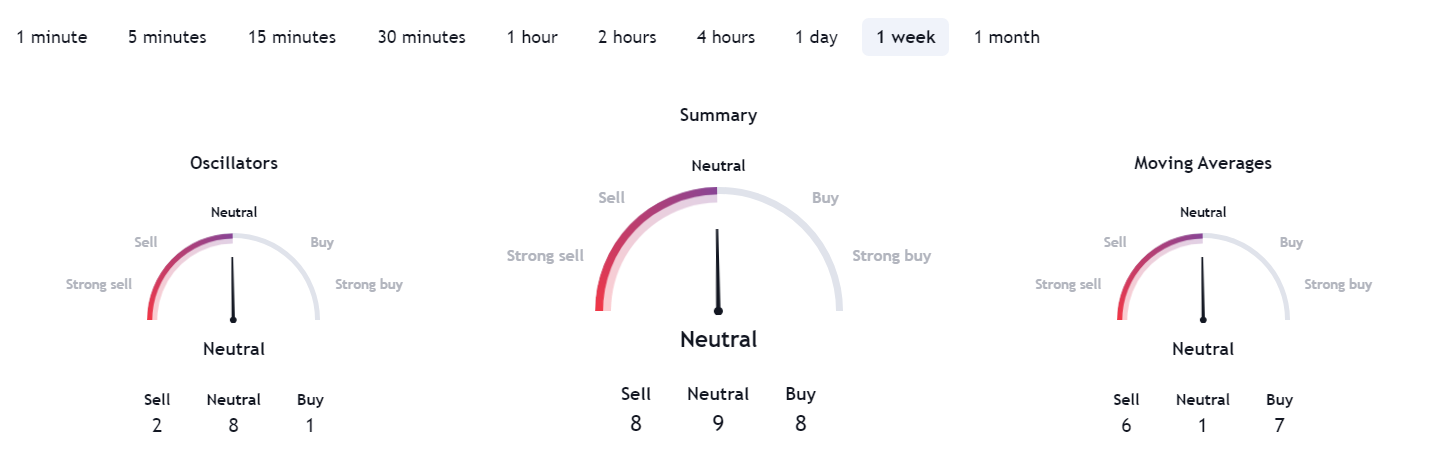
Simultaneously, technical analysis is remarkably inconclusive when based on the latest week of trading with both oscillators and moving averages reading ‘neutral’ leading to an overall ‘neutral’ rating.
PKR/USD price chart
Whichever way the wind may blow, the fact remains that, at $0.003551, PRKis at lows not seen in well over a month and is down 0.14% in the last 30 days, and 0.20% on the weekly chart.
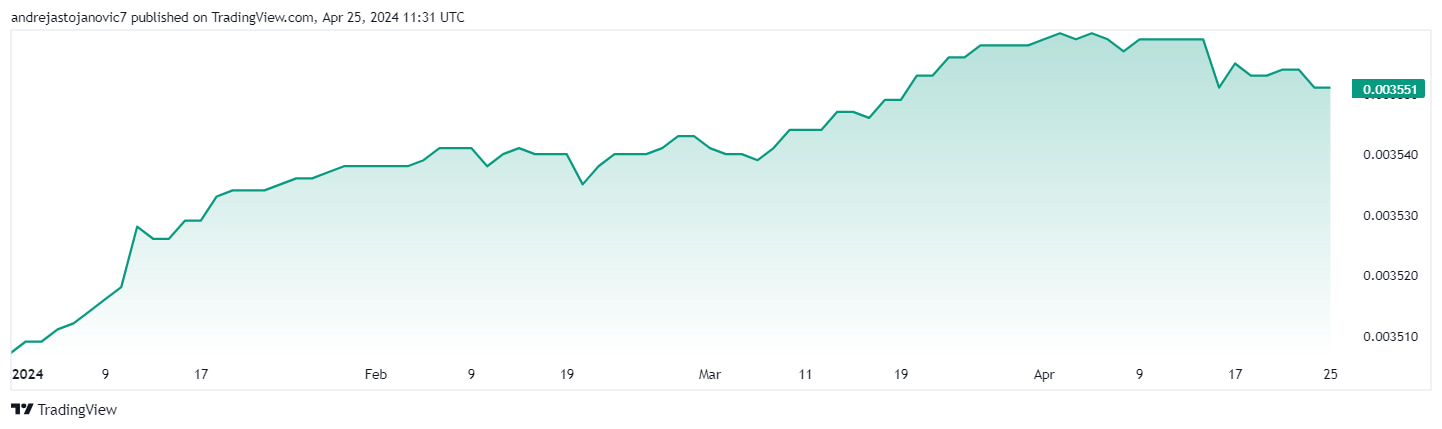
Still, in the longer term, PKR has been climbing against USD as it is up 1.25% year-to-date (YTD), 0.57% in the last 6 months, and 1.81% in the last 52 weeks.
Disclaimer: The content on this site should not be considered investment advice. Investing is speculative. When investing, your capital is at risk.
The post What’s happening with Pakistani Rupee vs. Dollar (USD/PKR)? appeared first on Finbold.